Building a modern weather platform is no longer just about showing temperature numbers. Today’s users expect real-time accuracy, smooth interactions, intelligent layouts, and mobile-first usability. A powerful weather website design blends data clarity, performance optimization, accessibility, and visual trust.
The Dark Weather UI concept designed by Devoq Design demonstrates how a modern digital weather platform can deliver rich forecasting, interactive dashboards, and seamless user journeys, making it ideal inspiration for startups, SaaS products, and data-driven platforms planning an online weather web design forecast platform.
This guide breaks down the design elements image by image so founders, product teams, and businesses can understand how to build a scalable weather website UI/UX design that users love.
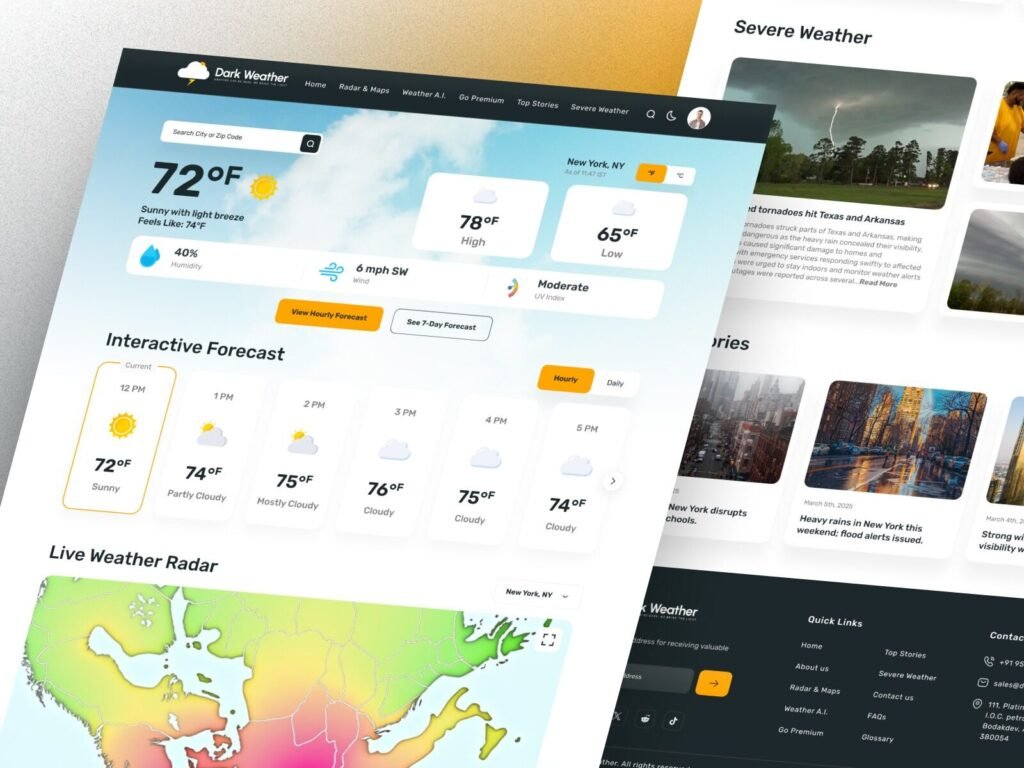
Homepage Weather Dashboard Interface
The first image showcases the main weather dashboard screen displaying current temperature, humidity, wind speed, UV index, and forecast summary. The layout uses large readable typography and visual weather icons to make data instantly understandable.
The search bar allows users to quickly locate their city or zip code, supporting user accessibility and speed. Action buttons like “View Hourly Forecast” and “See 7-Day Forecast” create a clear navigation flow.
This design approach strengthens modern weather website UI principles:
- Clear visual hierarchy
- High contrast readability
- Fast information scanning
- User-centered navigation
For startups building a real-time weather website design, this dashboard structure ensures users get value within seconds of landing on the platform.
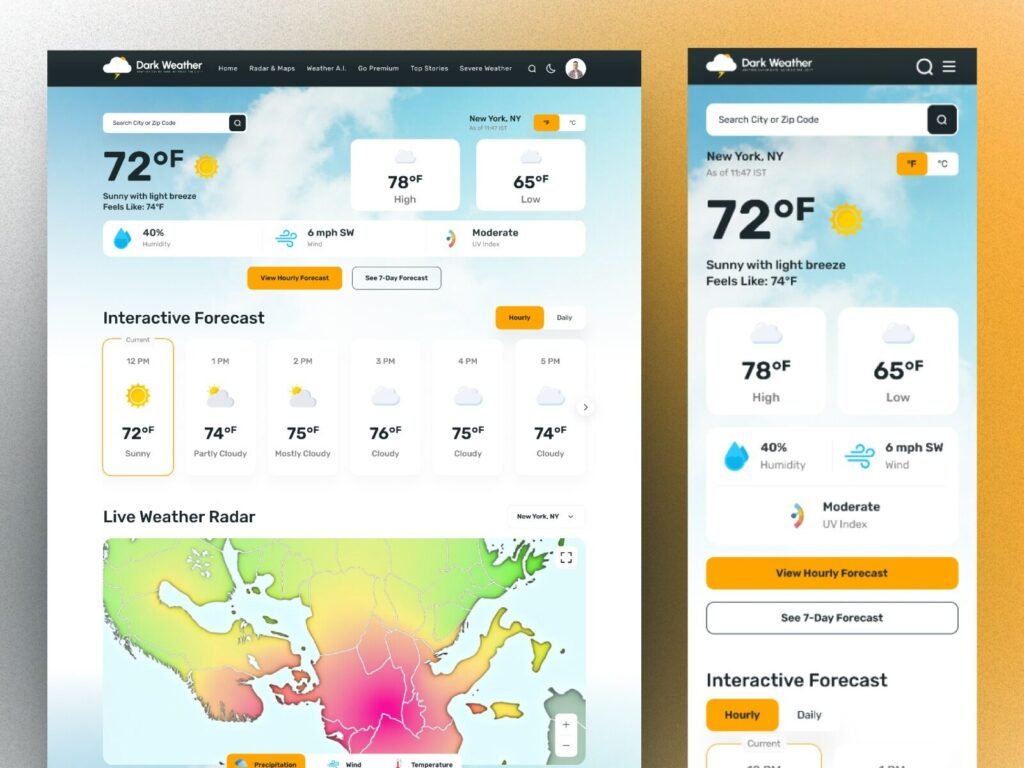
Responsive Mobile Weather Interface
This image highlights how the platform adapts beautifully across mobile screens. Core weather information remains easy to read while maintaining consistent navigation and button accessibility.
Mobile responsiveness is critical for any weather website design because most users access forecasts from smartphones during travel, outdoor planning, and emergencies.
Key mobile UX improvements visible:
- Thumb-friendly CTA buttons
- Vertical information stacking
- Simplified navigation
- Lightweight visuals
A responsive design improves SEO ranking and user retention, making it essential for modern web platforms.
Devoq Design focuses on usability-driven layouts so even complex datasets remain simple and approachable for everyday users.
Interactive Forecast & Live Radar Visualization
This image focuses on hourly forecasts and live radar maps showing precipitation, wind flow, and temperature zones. Interactive elements allow users to explore real-time weather movement visually instead of relying only on text.
Interactive visualization increases engagement and builds trust in data accuracy, a core component of smart weather monitoring website design.
Benefits include:
- Faster decision-making
- Improved user engagement
- Better understanding of climate patterns
- Enhanced data transparency
This type of visualization is ideal for enterprise platforms and weather SaaS products.
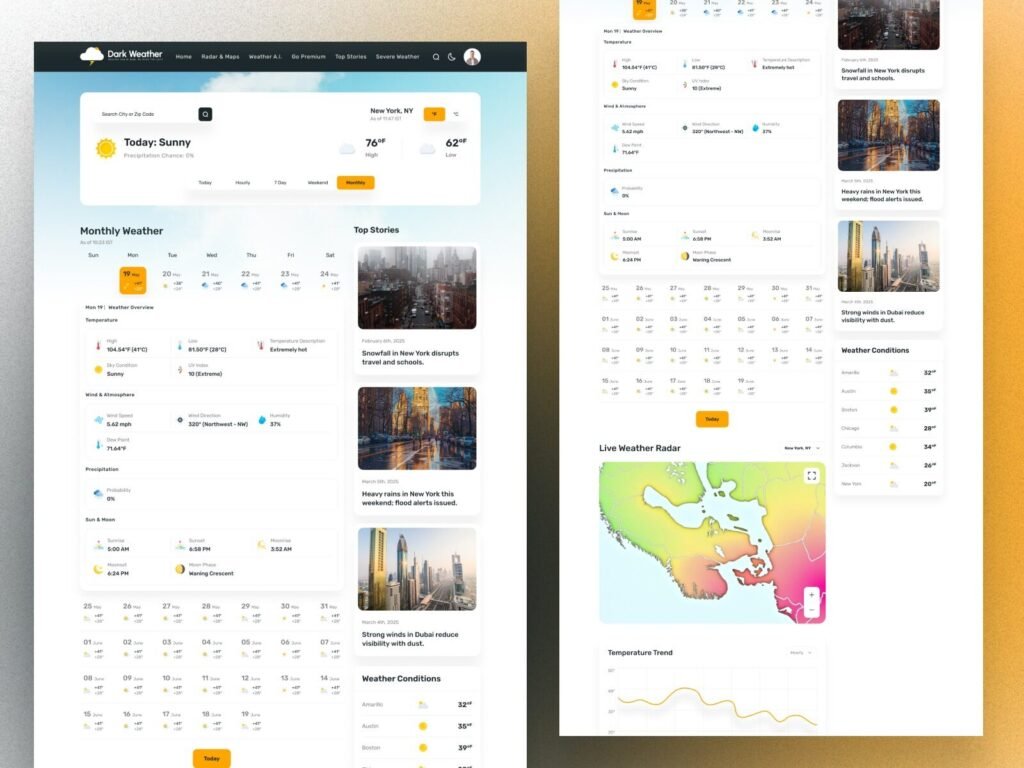
Monthly Forecast & News Integration
Here we see extended monthly forecasts alongside weather news and city condition summaries. Integrating content and data allows users to stay informed about climate trends and global events.
This hybrid layout supports:
- Longer session duration
- Content discovery
- Authority building
- Improved SEO indexing
For an online weather web design forecast platform, content integration improves organic reach and user trust.
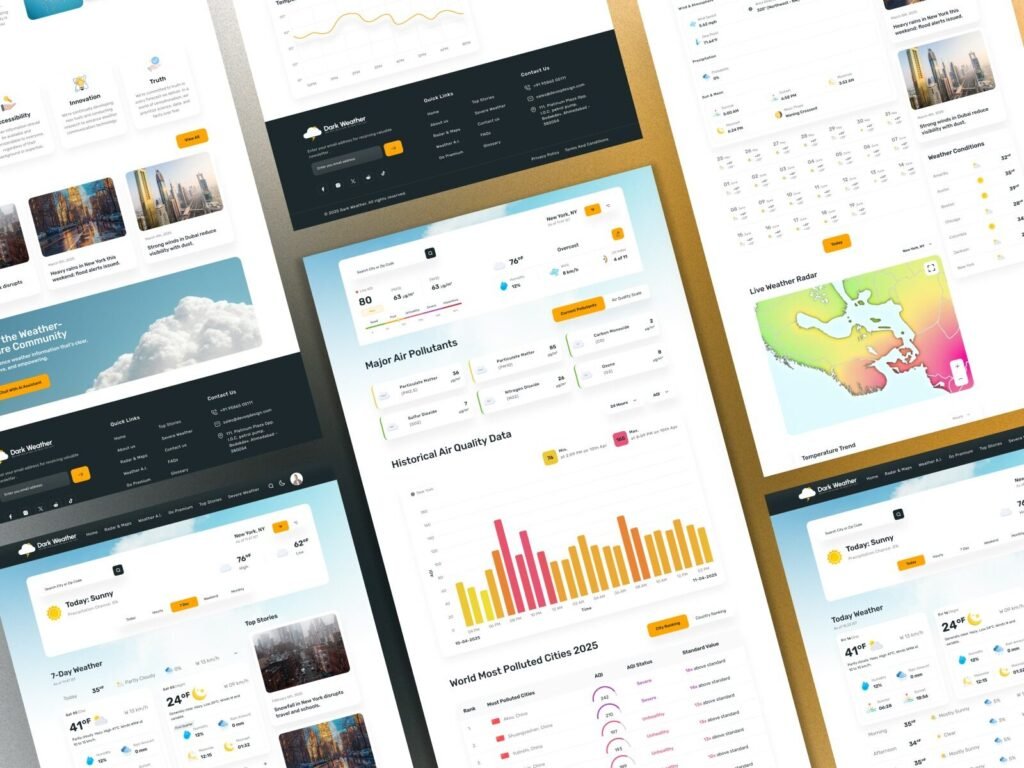
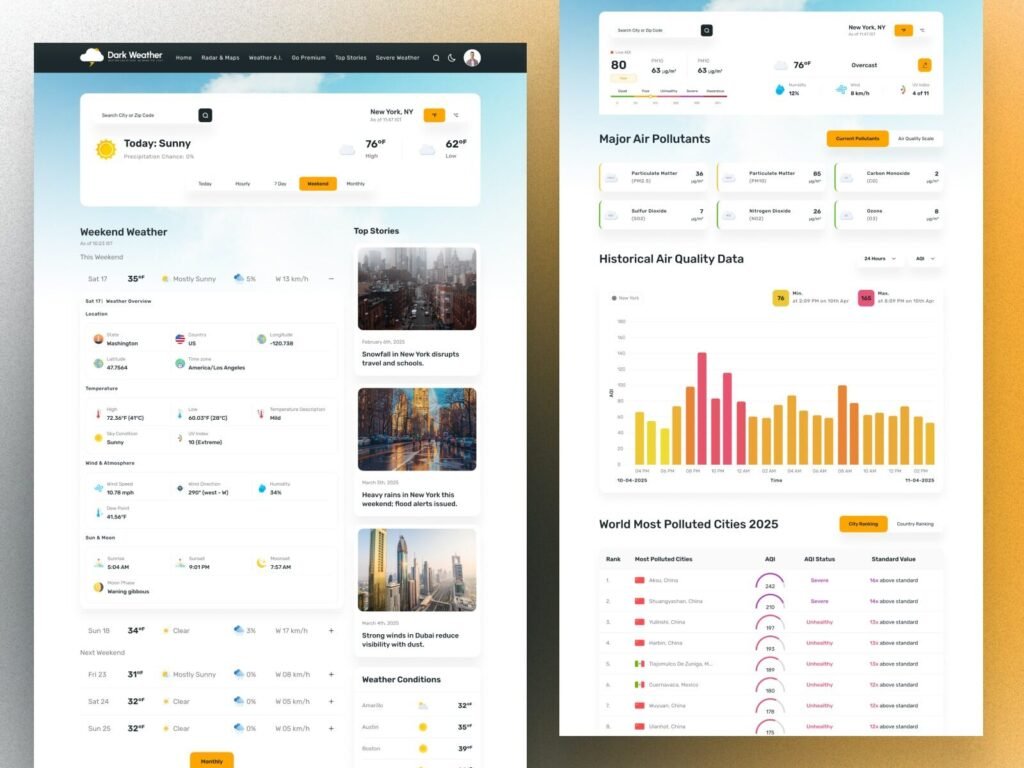
Air Quality Analytics Dashboard
This section visualizes air quality metrics including pollutants, AQI trends, and city rankings. Data visualization cards and bar charts present complex metrics in digestible formats.
Analytics dashboards increase platform value for research organizations, governments, and environmental monitoring companies.
Strong UI elements include:
- Color-coded severity indicators
- Data comparison tables
- Trend visualization
This supports advanced weather website UI/UX design requirements for data-heavy platforms.
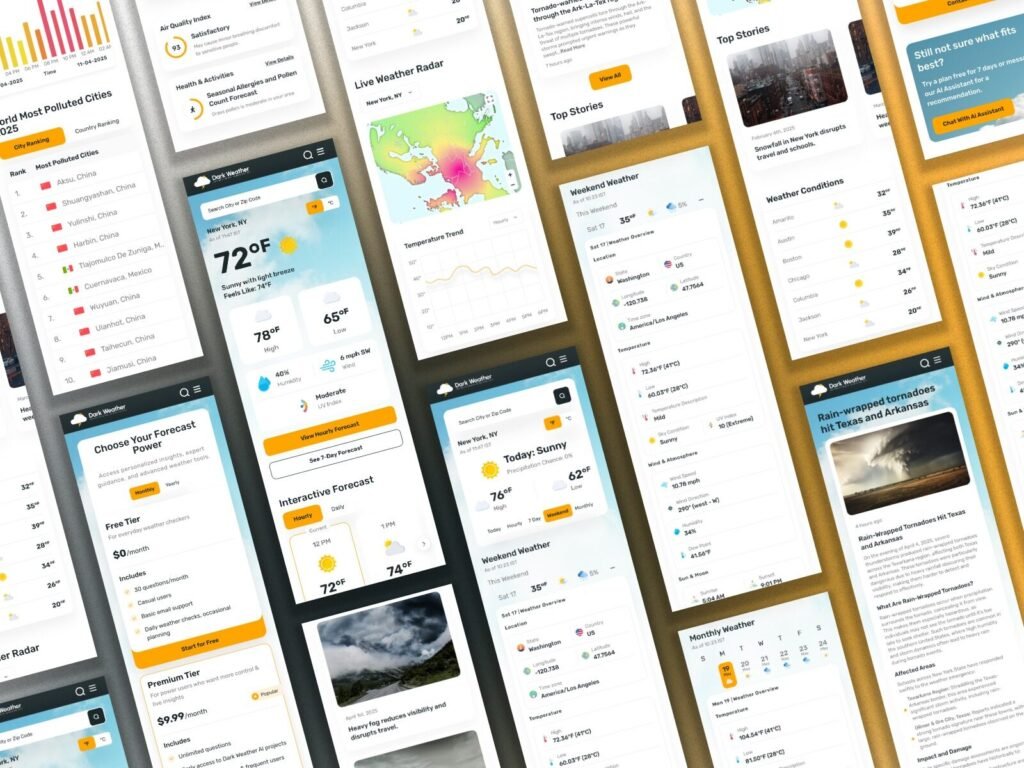
Weekend Forecast & Detailed Weather Breakdown
This image highlights weekend forecasts with granular data such as sunrise, humidity, wind direction, precipitation probability, and temperature ranges.
Detailed breakdown improves decision planning for travel, logistics, and events — strengthening the reliability of the platform.
This layout supports scalable real-time weather website design for professional use cases.
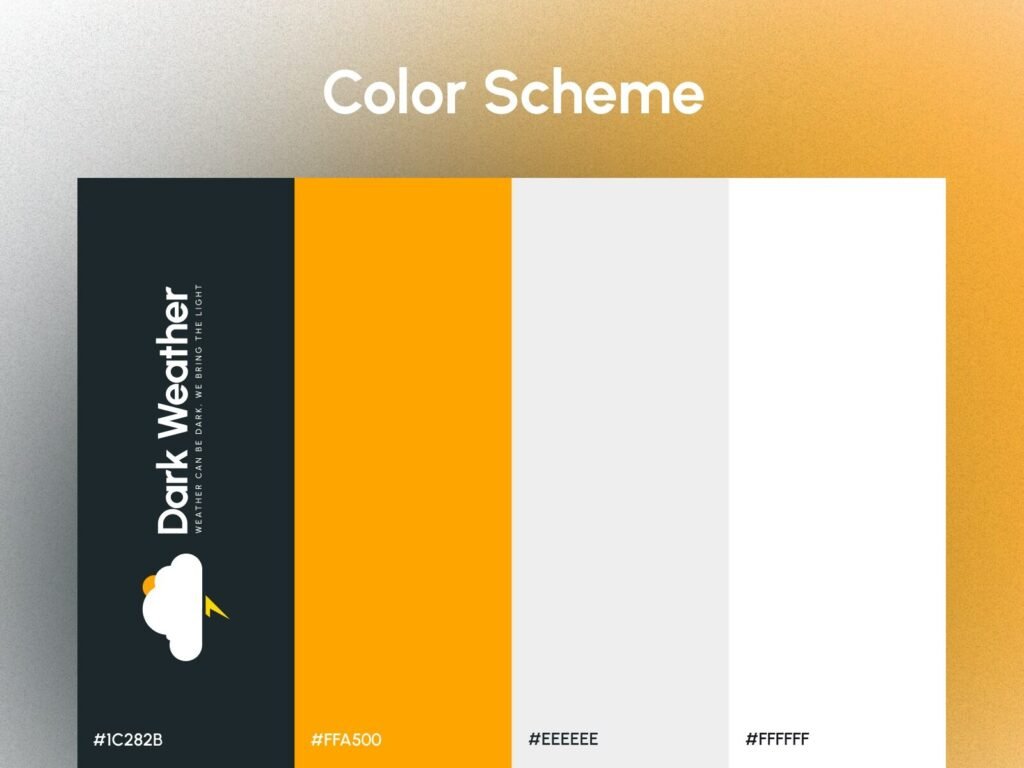
Design System: Color Palette
This image showcases the brand color system using dark tones with yellow accent highlights and neutral backgrounds. Color psychology supports clarity preventing visual fatigue while maintaining high contrast for accessibility.
Consistent branding strengthens trust and memorability across devices.
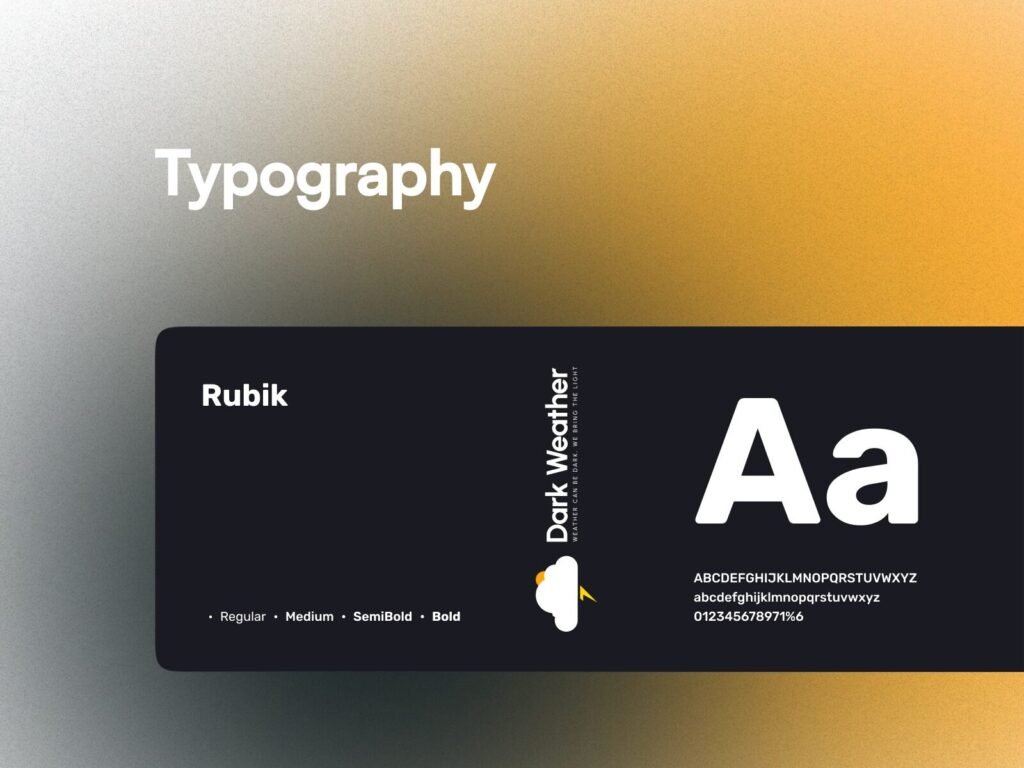
Typography System
Typography uses the Rubik font with multiple weights, ensuring excellent legibility across dashboards and mobile views. Proper typography hierarchy improves scanning speed and content clarity.
Readable typography directly impacts usability and conversion.
Why Devoq Design Delivers High-Performance Weather Platforms
Devoq Design specializes in building scalable digital products with strong UX foundations. Their approach combines:
✔ User research
✔ Performance optimization
✔ Responsive layouts
✔ SEO-friendly structure
✔ Conversion-driven UI
✔ Brand consistency
Whether launching a startup MVP or enterprise platform, their custom weather website design services ensure long-term scalability.
Conclusion
A modern weather platform must deliver speed, clarity, trust, and engagement. The Dark Weather UI demonstrates how thoughtful interface design transforms raw weather data into meaningful digital experiences.
For businesses seeking a scalable weather website UI UX design, partnering with an experienced agency like Devoq Design enables faster go-to-market success while maintaining long-term product quality.